

- Pricing — each model gets a public or private price.
- Attribution — every request is tied to a user, team, virtual account, model, and any metadata you attach.
- Reporting — costs are broken down in Metrics and can be exported.
Set model pricing
Pricing is set per model, in the model’s configuration under its provider account.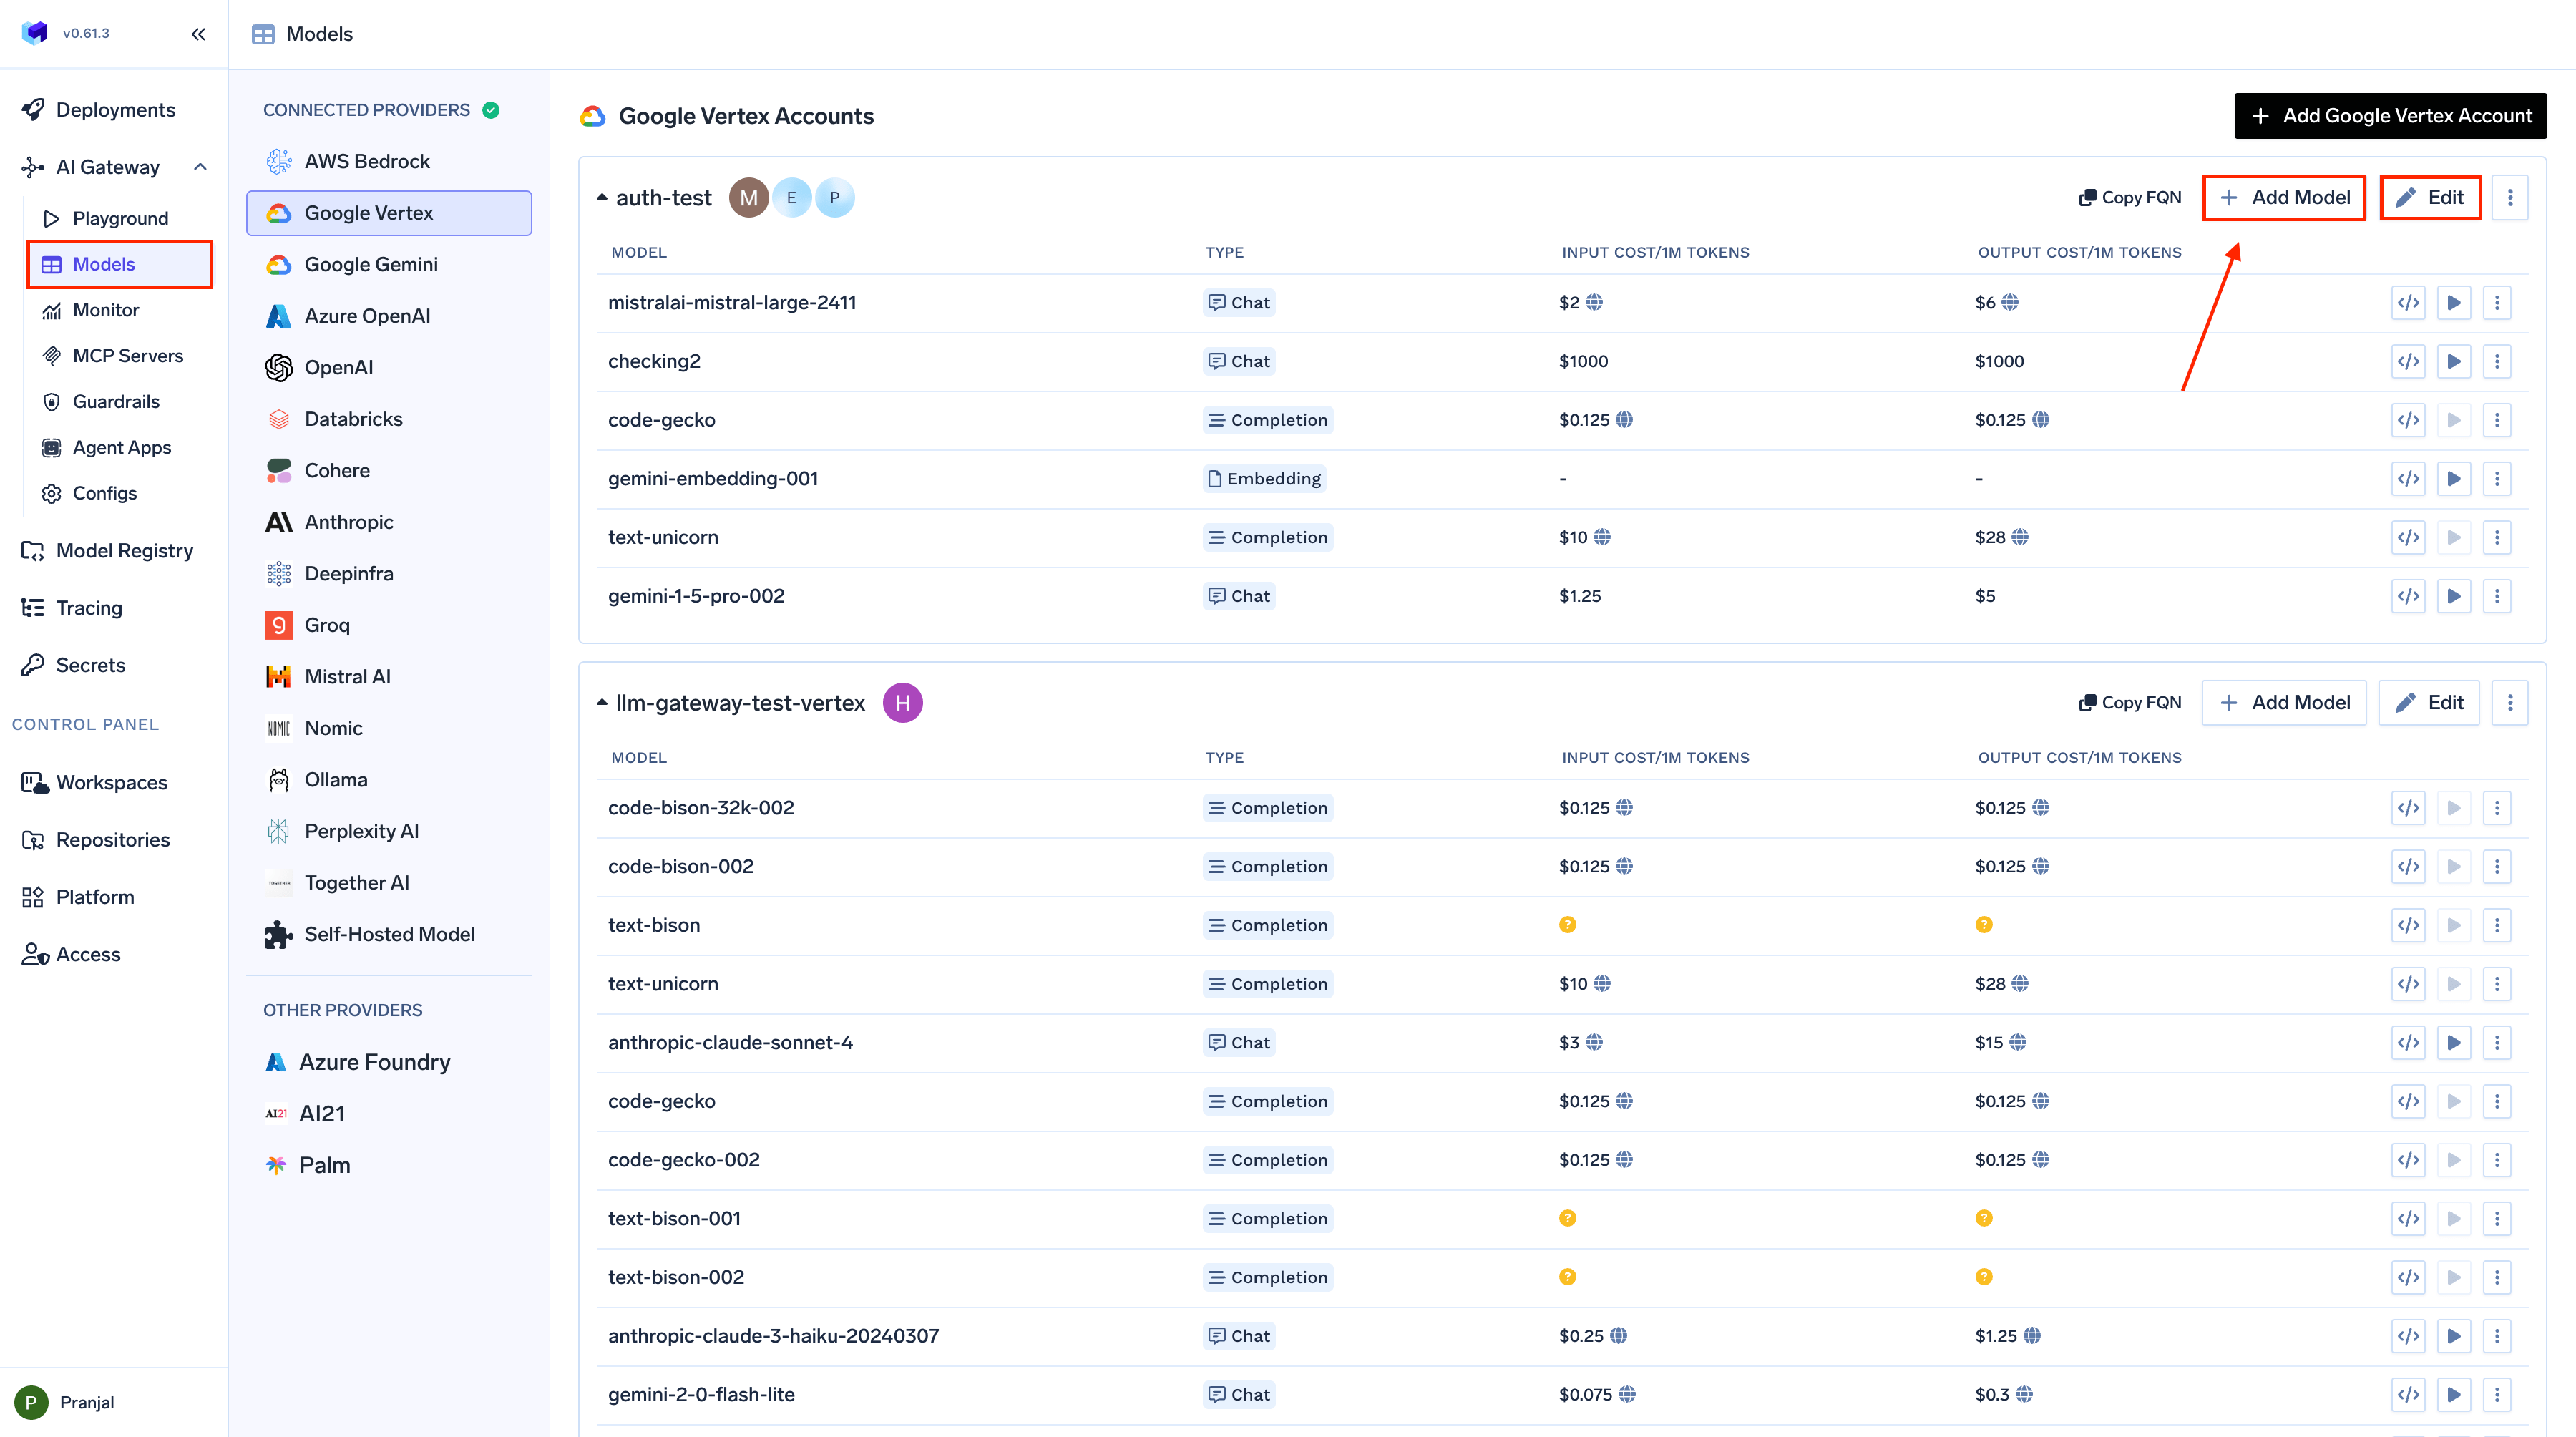
Cost options in the model configuration
- Public cost
- Private cost
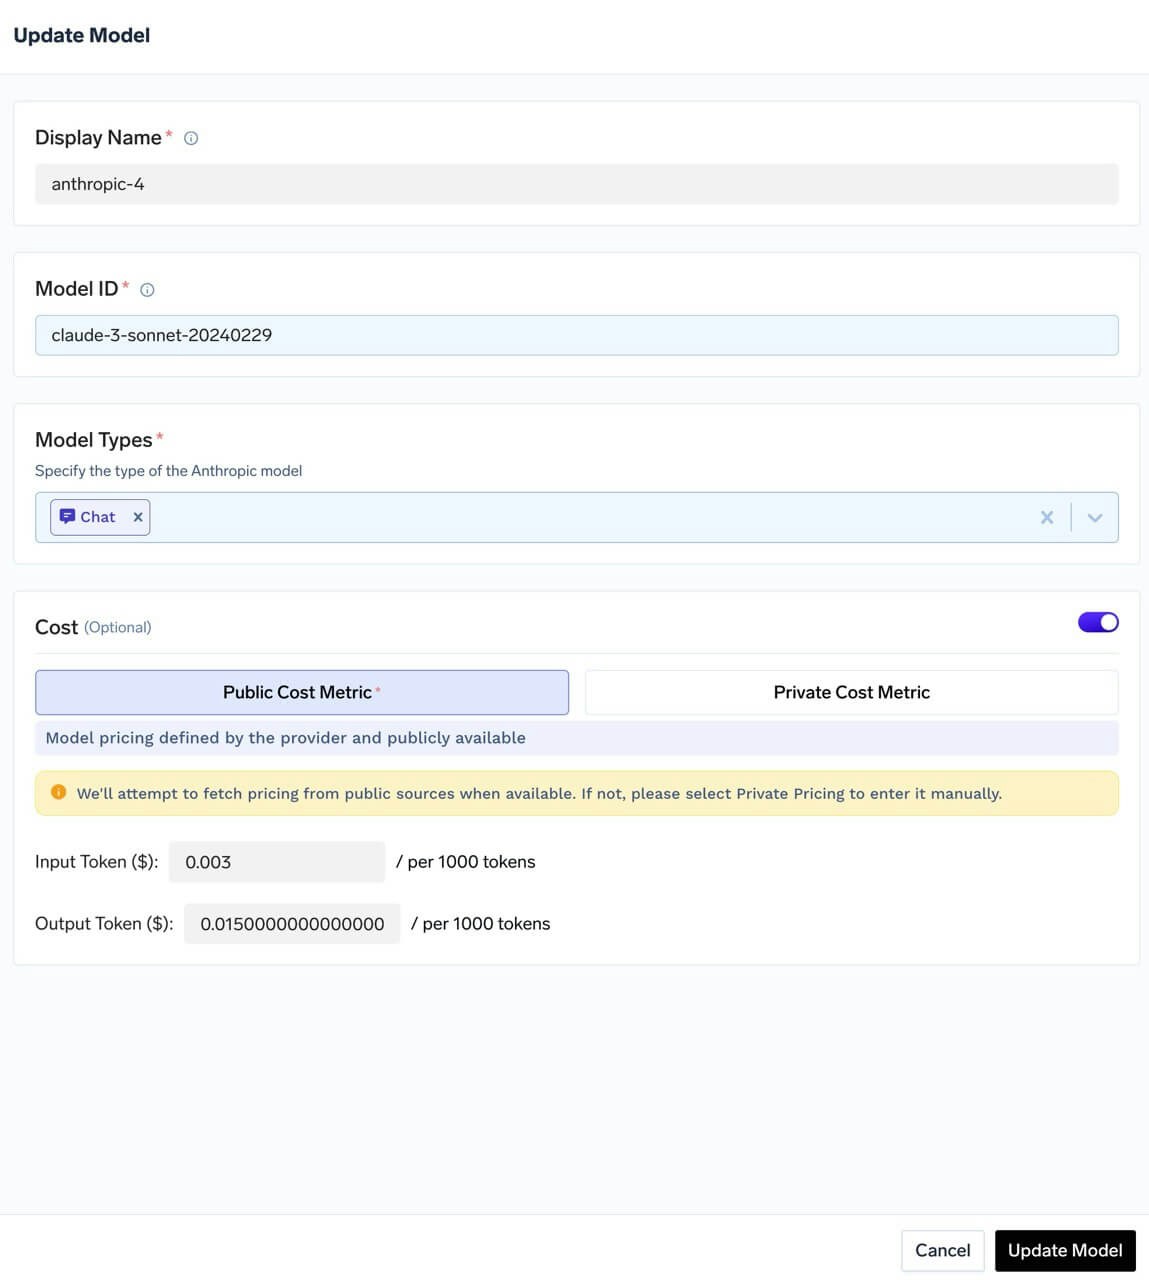
Public cost
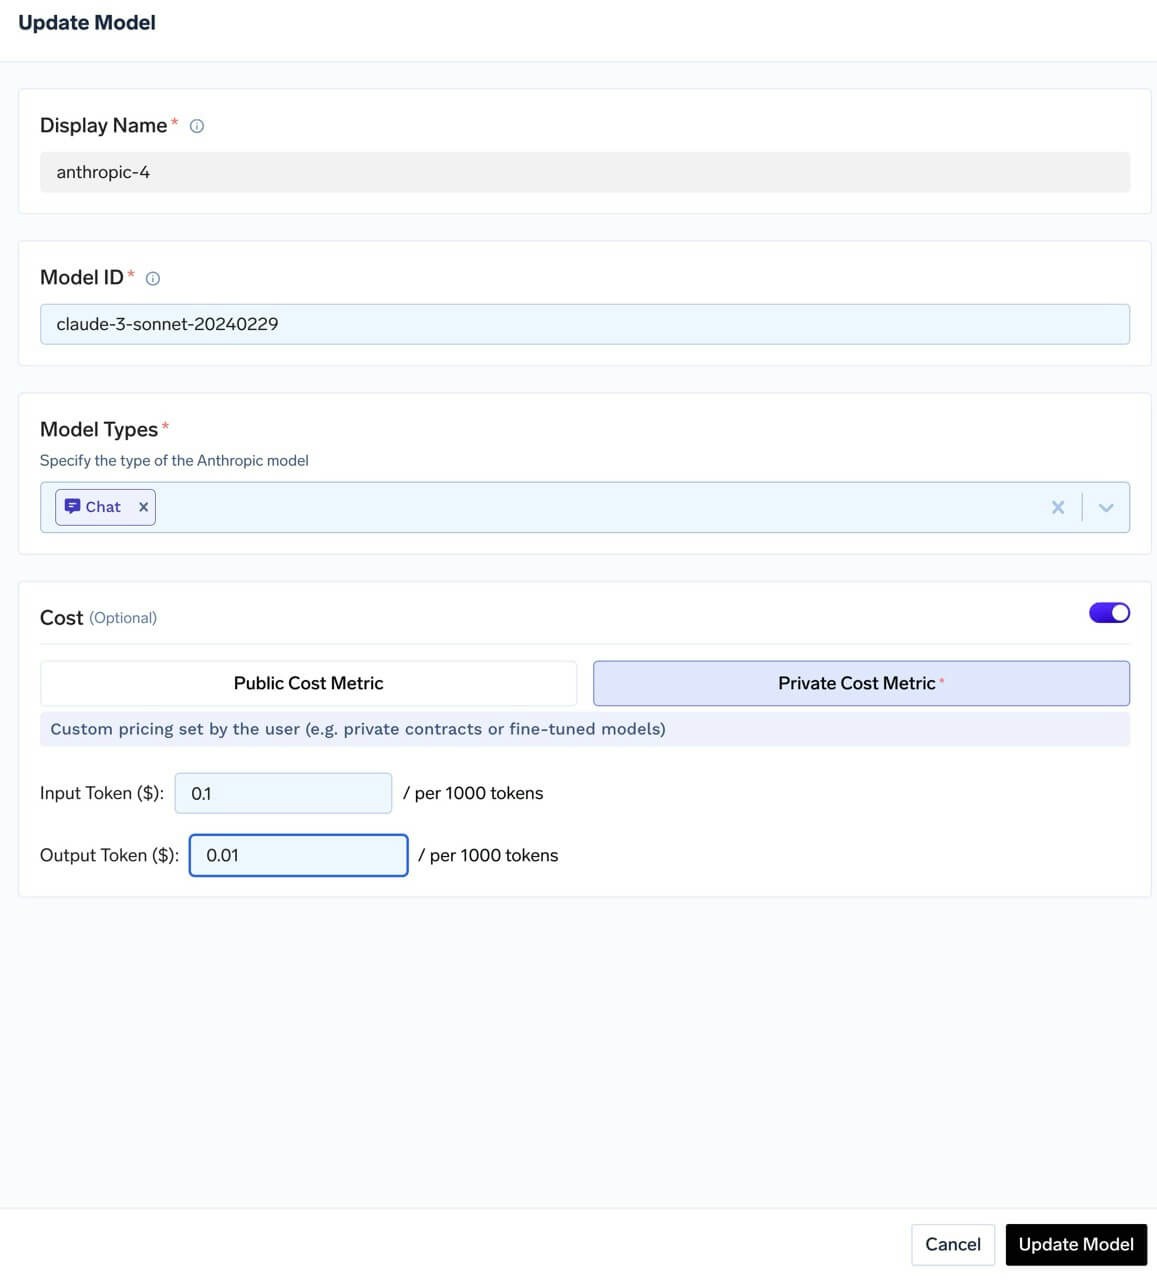
How cost is calculated
Where public pricing comes from
Where public pricing comes from
TrueFoundry maintains an open-source pricing catalog in the truefoundry/models GitHub repository. This repository acts as the pricing database used by AI Gateway for public cost tracking.The same pricing data is also viewable on the public TrueFoundry Models dashboard, so you can inspect model pricing outside of your workspace as well.When AI Gateway calculates cost using public pricing, it considers:
- Region-wise pricing: If a model has different rates by deployment region, the matching regional rate is used. For example, AWS Bedrock’s Nova Lite uses different input/output costs per token in
us-west-2,us-west-1,eu-central-1, andeu-west-1. - Tiered pricing: If a provider defines usage tiers (e.g. different rates at different volume thresholds), the applicable tier is selected. For example, Gemini 2.5 Pro has base rates and higher rates from 200K tokens; Gemini 1.5 Flash has tiers starting at 128K tokens.
Pricing units: tokens, characters, and audio seconds
Pricing units: tokens, characters, and audio seconds
Not every model is billed per token, so the catalog carries a different rate field depending on what the provider actually charges for:
The catalog stores audio rates per single character and per single second. The console normalises them for display, showing per 1M characters and per minute of audio, so a rate that reads
0.0001 in the catalog appears as $100 per 1M characters in the cost UI.Where the billed quantity comes from differs between the two audio directions, and it matters:- Text-to-speech counts the characters in your request text, as Unicode code points, before the request is sent upstream.
- Speech-to-text takes the audio duration from the provider’s response. If a provider does not report a duration, no billable seconds are recorded and the request is costed at zero.
Audio cost tracking is wired up for ElevenLabs and Google Vertex text-to-speech and speech-to-text. Other audio providers routed through the gateway record usage but not per-character or per-second cost. Private (custom) audio pricing can currently be entered for Google Vertex only.
Cached tokens and image models
Cached tokens and image models
Some providers bill cached input tokens at a different rate for text and for images. For example, OpenAI charges Why this formula:
$1.25 per 1M for cached text input but $2.00 per 1M for cached image input on gpt-image-1.5 and gpt-image-2-family models (gpt-image-1 is $2.50 per 1M). The catalog models this with two fields:If a model has no
cache_read_input_image_token_cost, cached image tokens are billed at cache_read_input_token_cost, so models without a separate image cache rate are priced exactly as before.Formula (chat and image endpoints, per request):- Every input token is billed exactly once.
input_tokensalready includes cached and image tokens, so the formula splits it into non-overlapping buckets: text, uncached image, cached text, cached image, and cache writes. A cached image token sits in both the cached and image counts, so it is removed fromuncached_imageand billed only at the cached image rate. - Cached image tokens are capped at the cache-read total.
min(...)stops a malformed usage report from billing more cached tokens than the provider says were read from cache. - The fallback keeps existing prices stable. Models without the new field keep their current cost.
The gateway can only apply the cached image rate when the provider reports how many cached tokens are images, as
cached_tokens_details.image_tokens in the usage object. OpenAI’s Images API reports an aggregate cached_tokens at most, and its documentation says cached image pricing for GPT Image 2 and 2.5 applies only to the image generation tool in the Responses API, not to /v1/images/edits. When no image breakdown is reported, the gateway leaves the cached count unused and bills those tokens at the regular input rates. An explicit 0 is treated as a reported breakdown. The cached text tokens are then billed at the cache-read rate.View costs
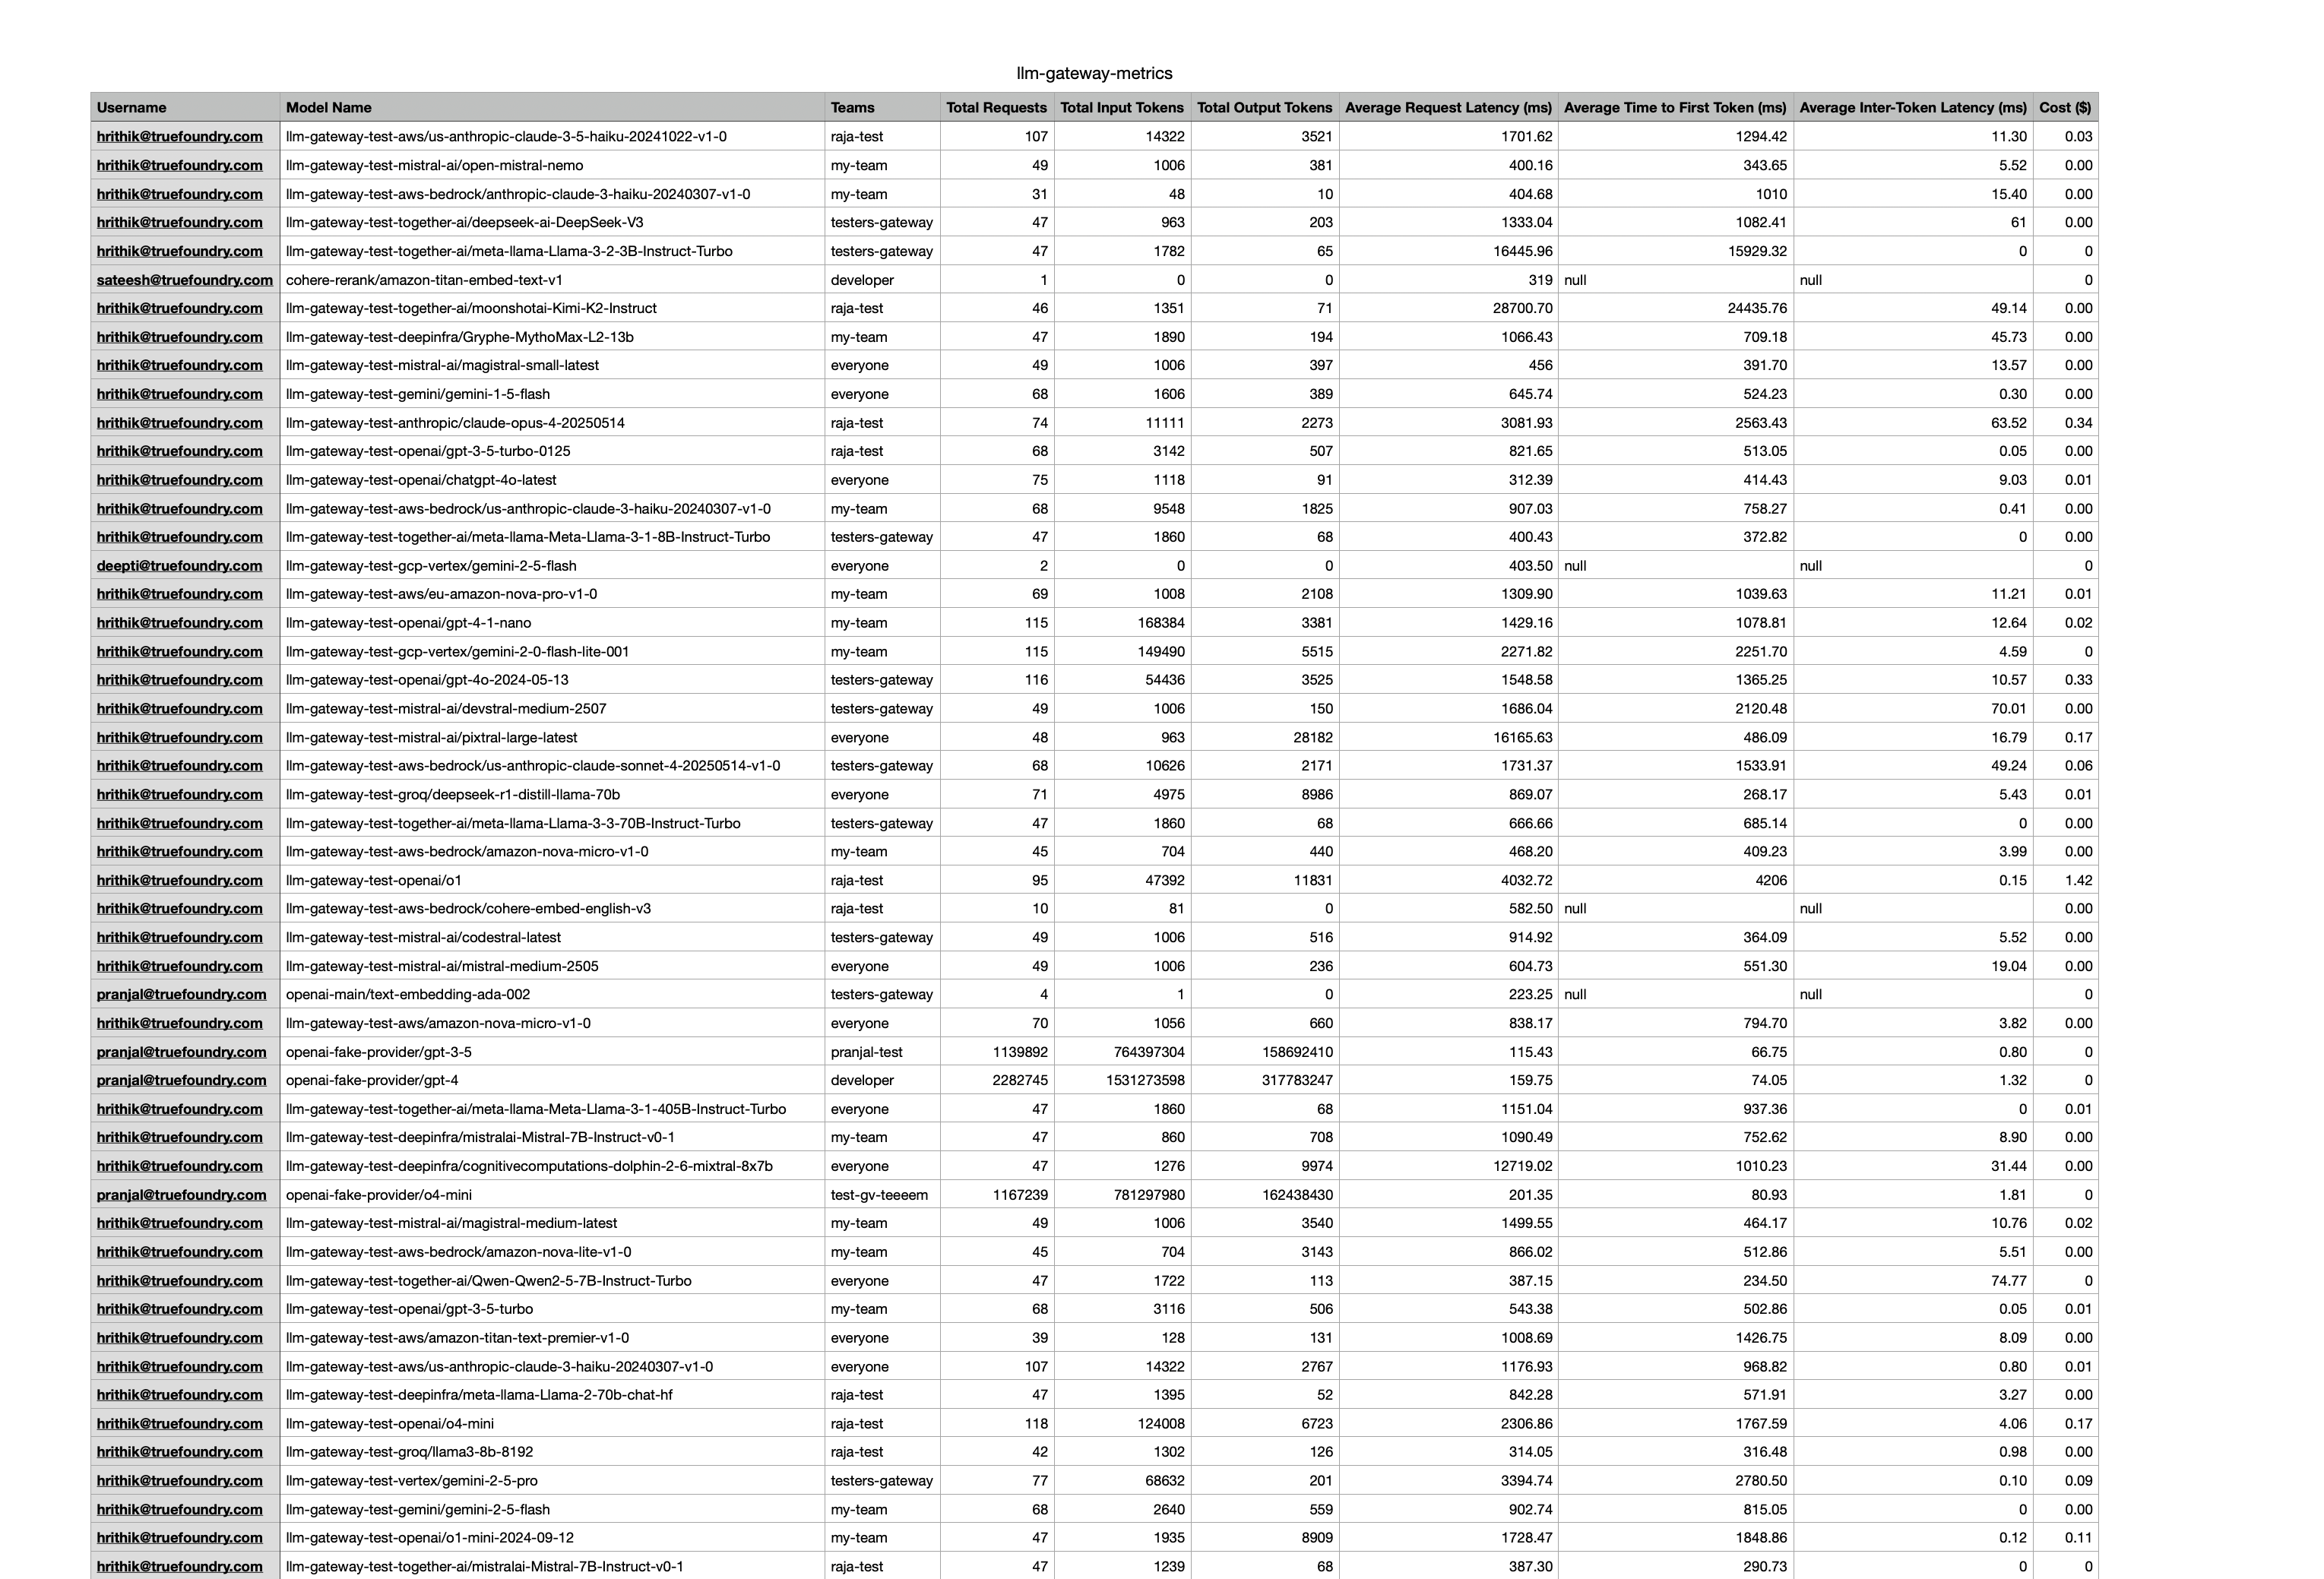
Every request is costed as it passes through the gateway, and the results appear in Metrics alongside usage.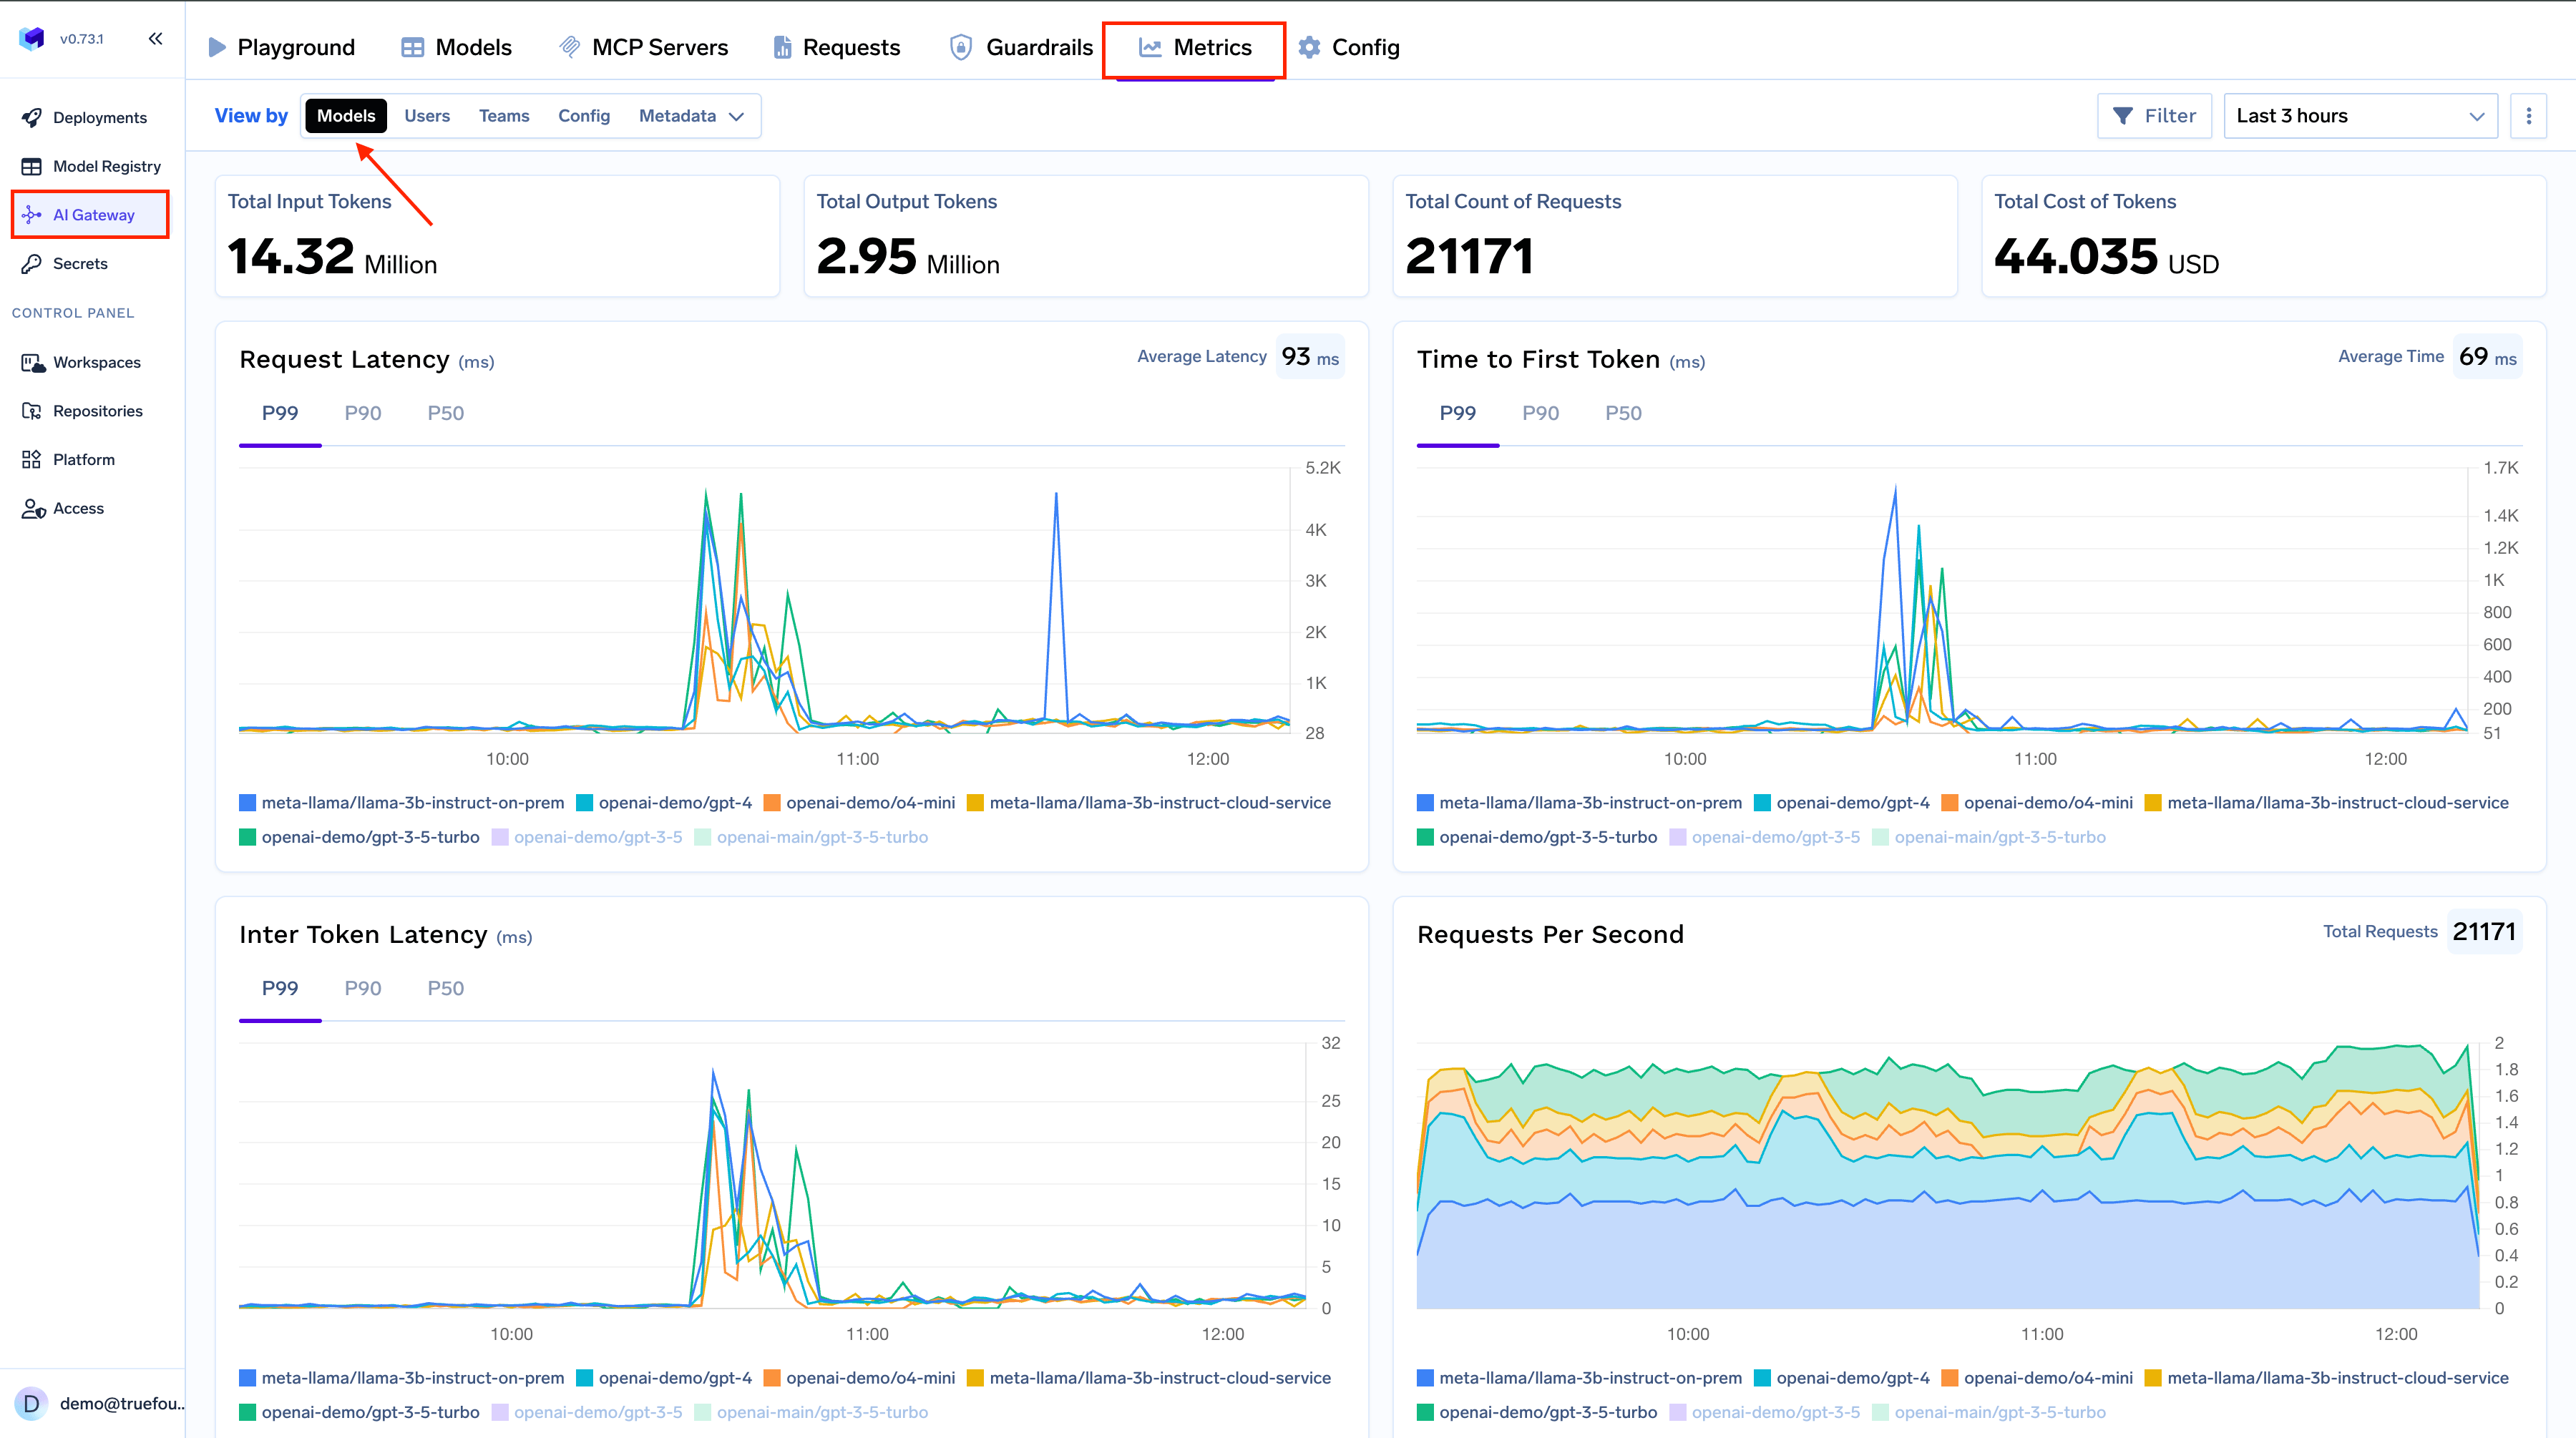
Metrics page overview
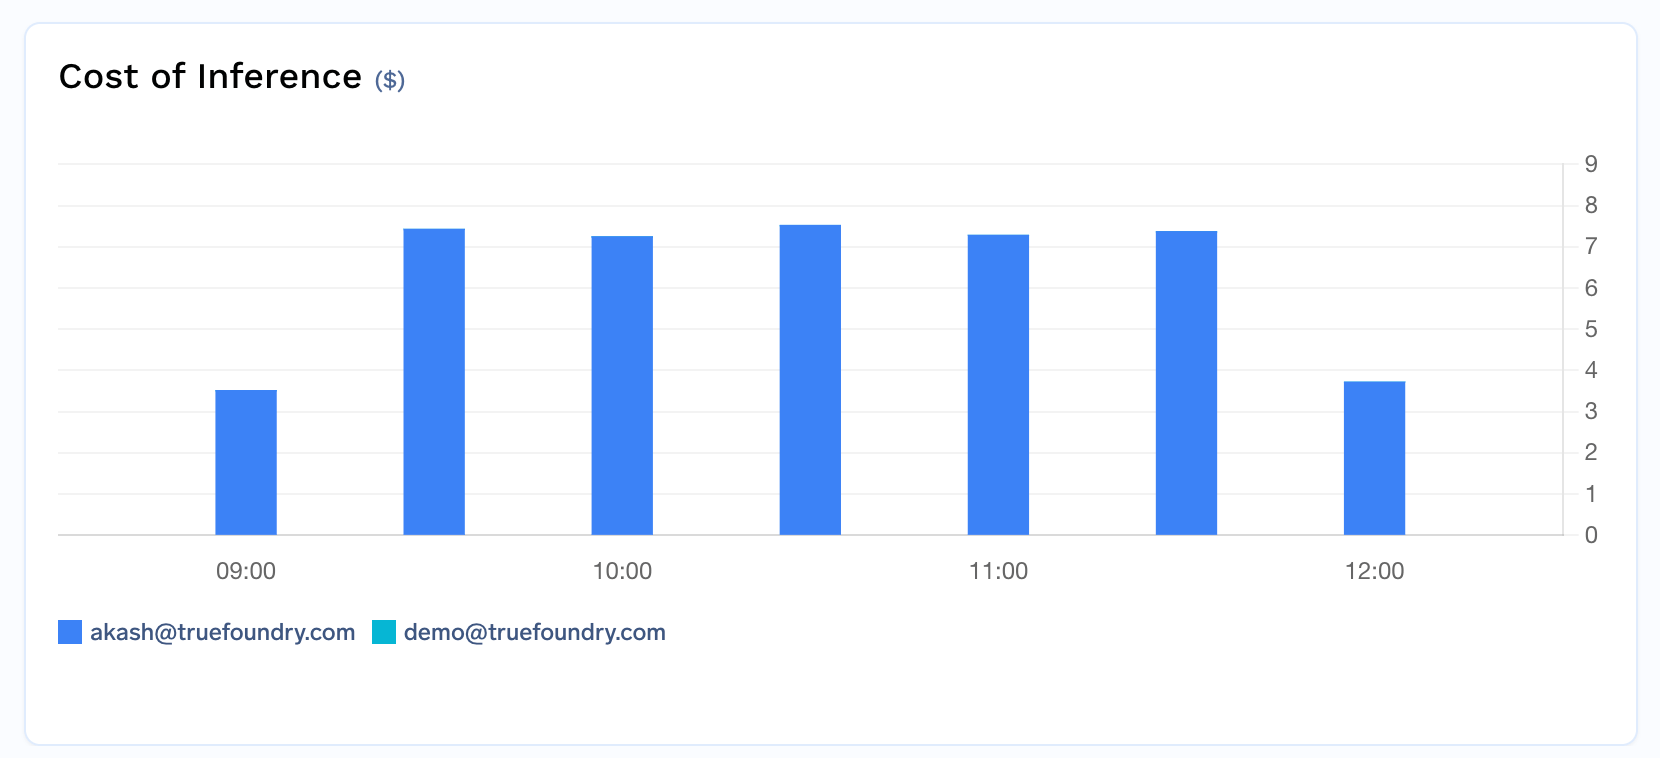
Cost by user
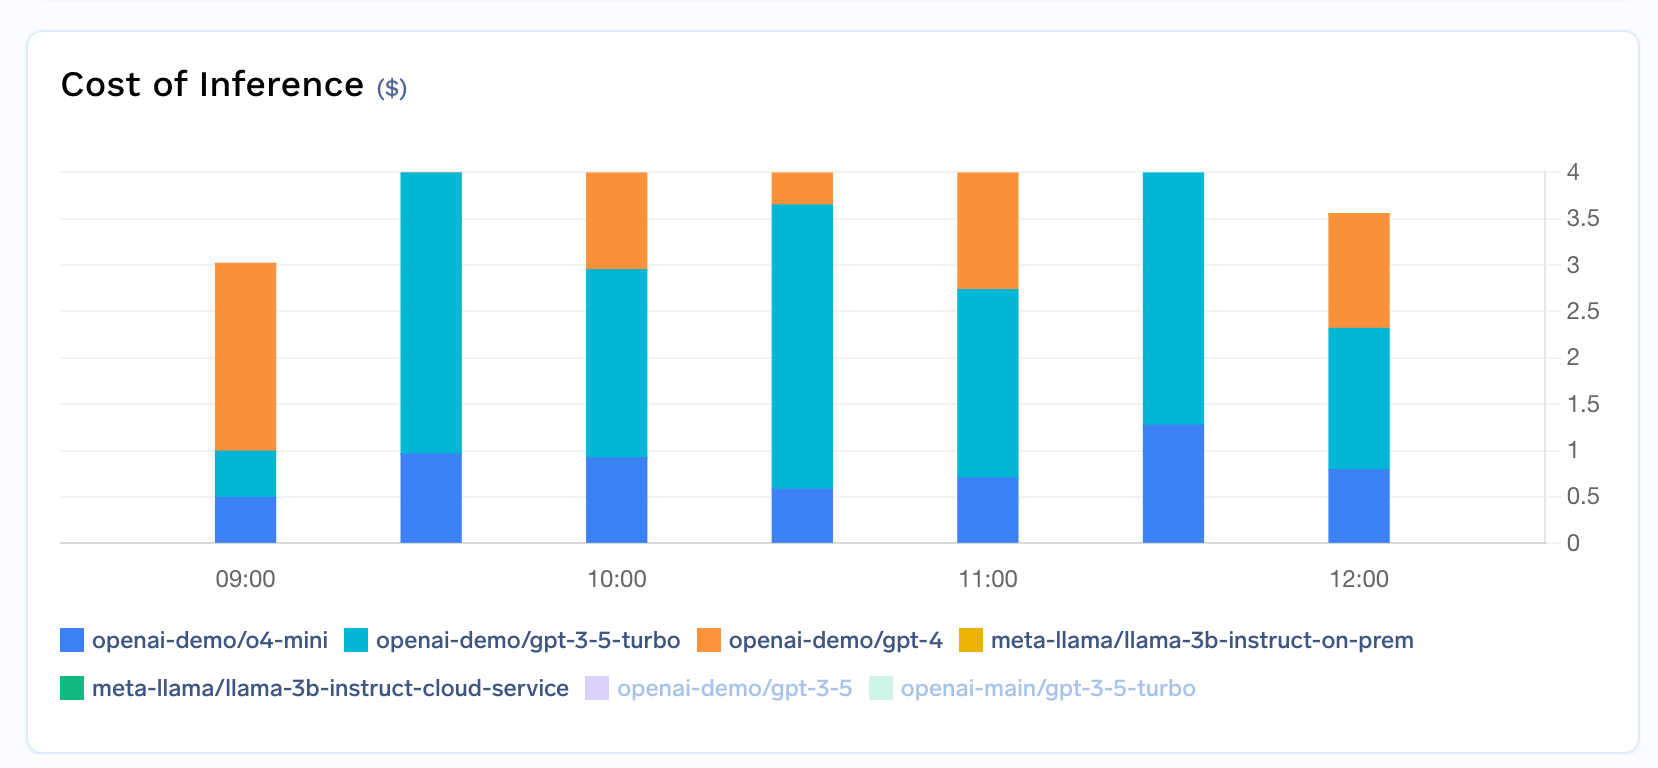
Cost by model
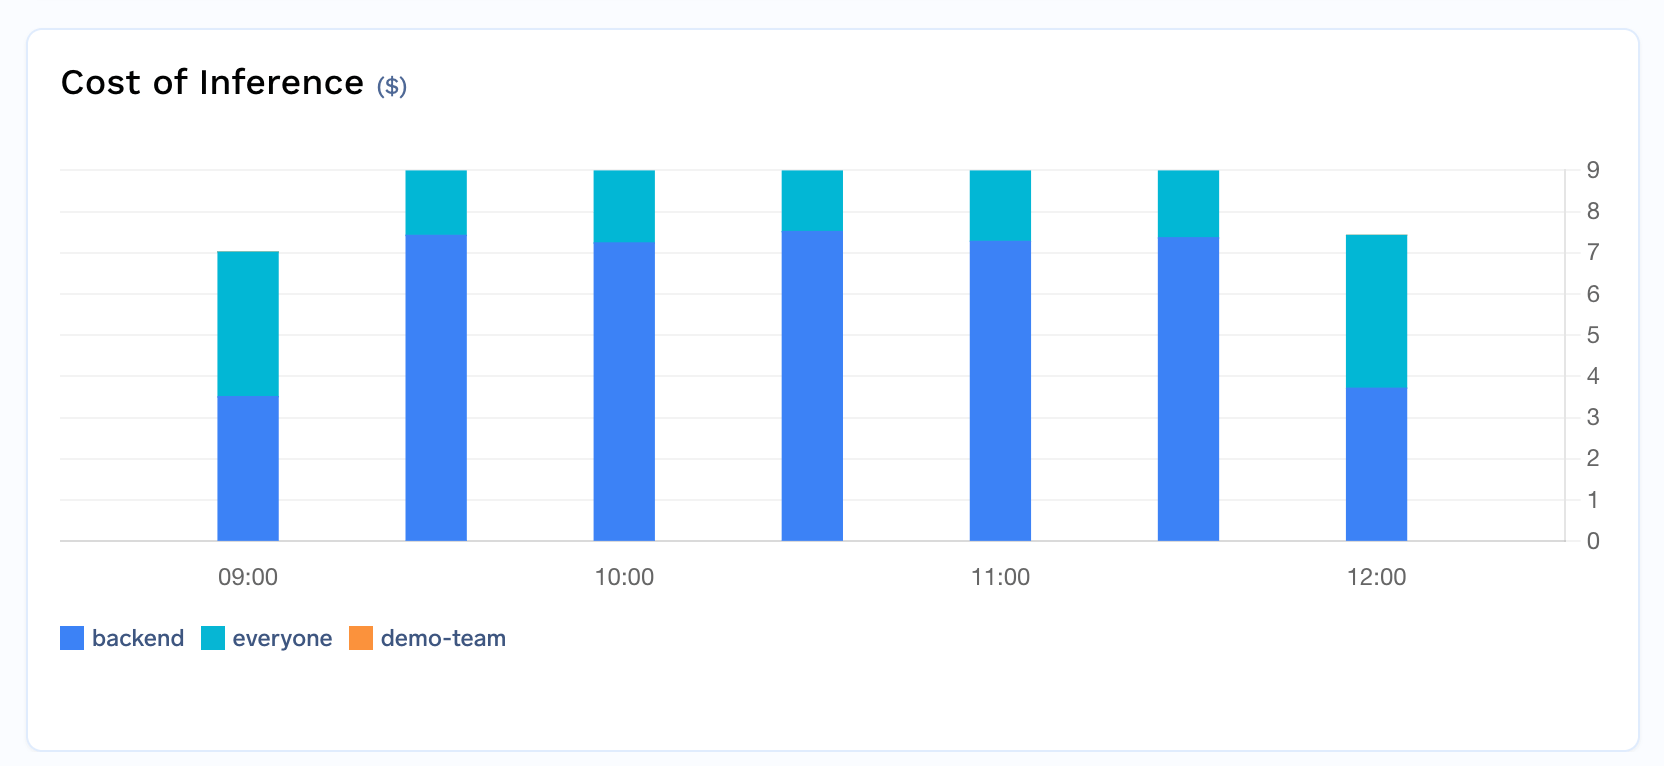
Cost by team
- By user — who is driving spend.
- By model — which models cost the most.
- By team — spend per department or project, for chargeback.
Attribute costs with metadata
Beyond the built-in user, model, and team breakdowns, you can use custom metadata to build fine-grained cost attribution tailored to your organization’s structure — by application, environment, customer, cost center, or any other dimension.Attach metadata automatically
TrueFoundry can automatically inject metadata into requests, enabling cost attribution without any client-side changes:1
Tag virtual accounts
Assign tags to your virtual accounts (e.g.,
application, environment, cost_center). These tags are automatically injected as metadata on every request made with that account’s token, giving you per-application and per-environment cost breakdowns without modifying any code.2
Associate PATs with teams
When a PAT is associated with a team, and that team has tags configured, those tags are automatically added to every request. This provides automatic team-level cost attribution for individual users. Admins can mandate team selection to ensure every PAT is tied to a team.
3
Enforce metadata with validation
Use the Metadata Validation guardrail to require specific metadata keys on every request. For example, mandate that every request includes a
cost_center or project_id key — requests missing required metadata are rejected before reaching the model, ensuring complete cost attribution across your organization.Group costs by metadata
Once metadata is attached to requests (either manually or via automatic injection), you can filter and group cost data by any metadata key in the Metrics dashboard. For example:- Group by
applicationto see cost per service - Group by
environmentto compare staging vs. production spend - Group by
customer_idto track per-customer costs for chargeback
groupBy fields to get detailed breakdowns in your exported reports.
Export cost data
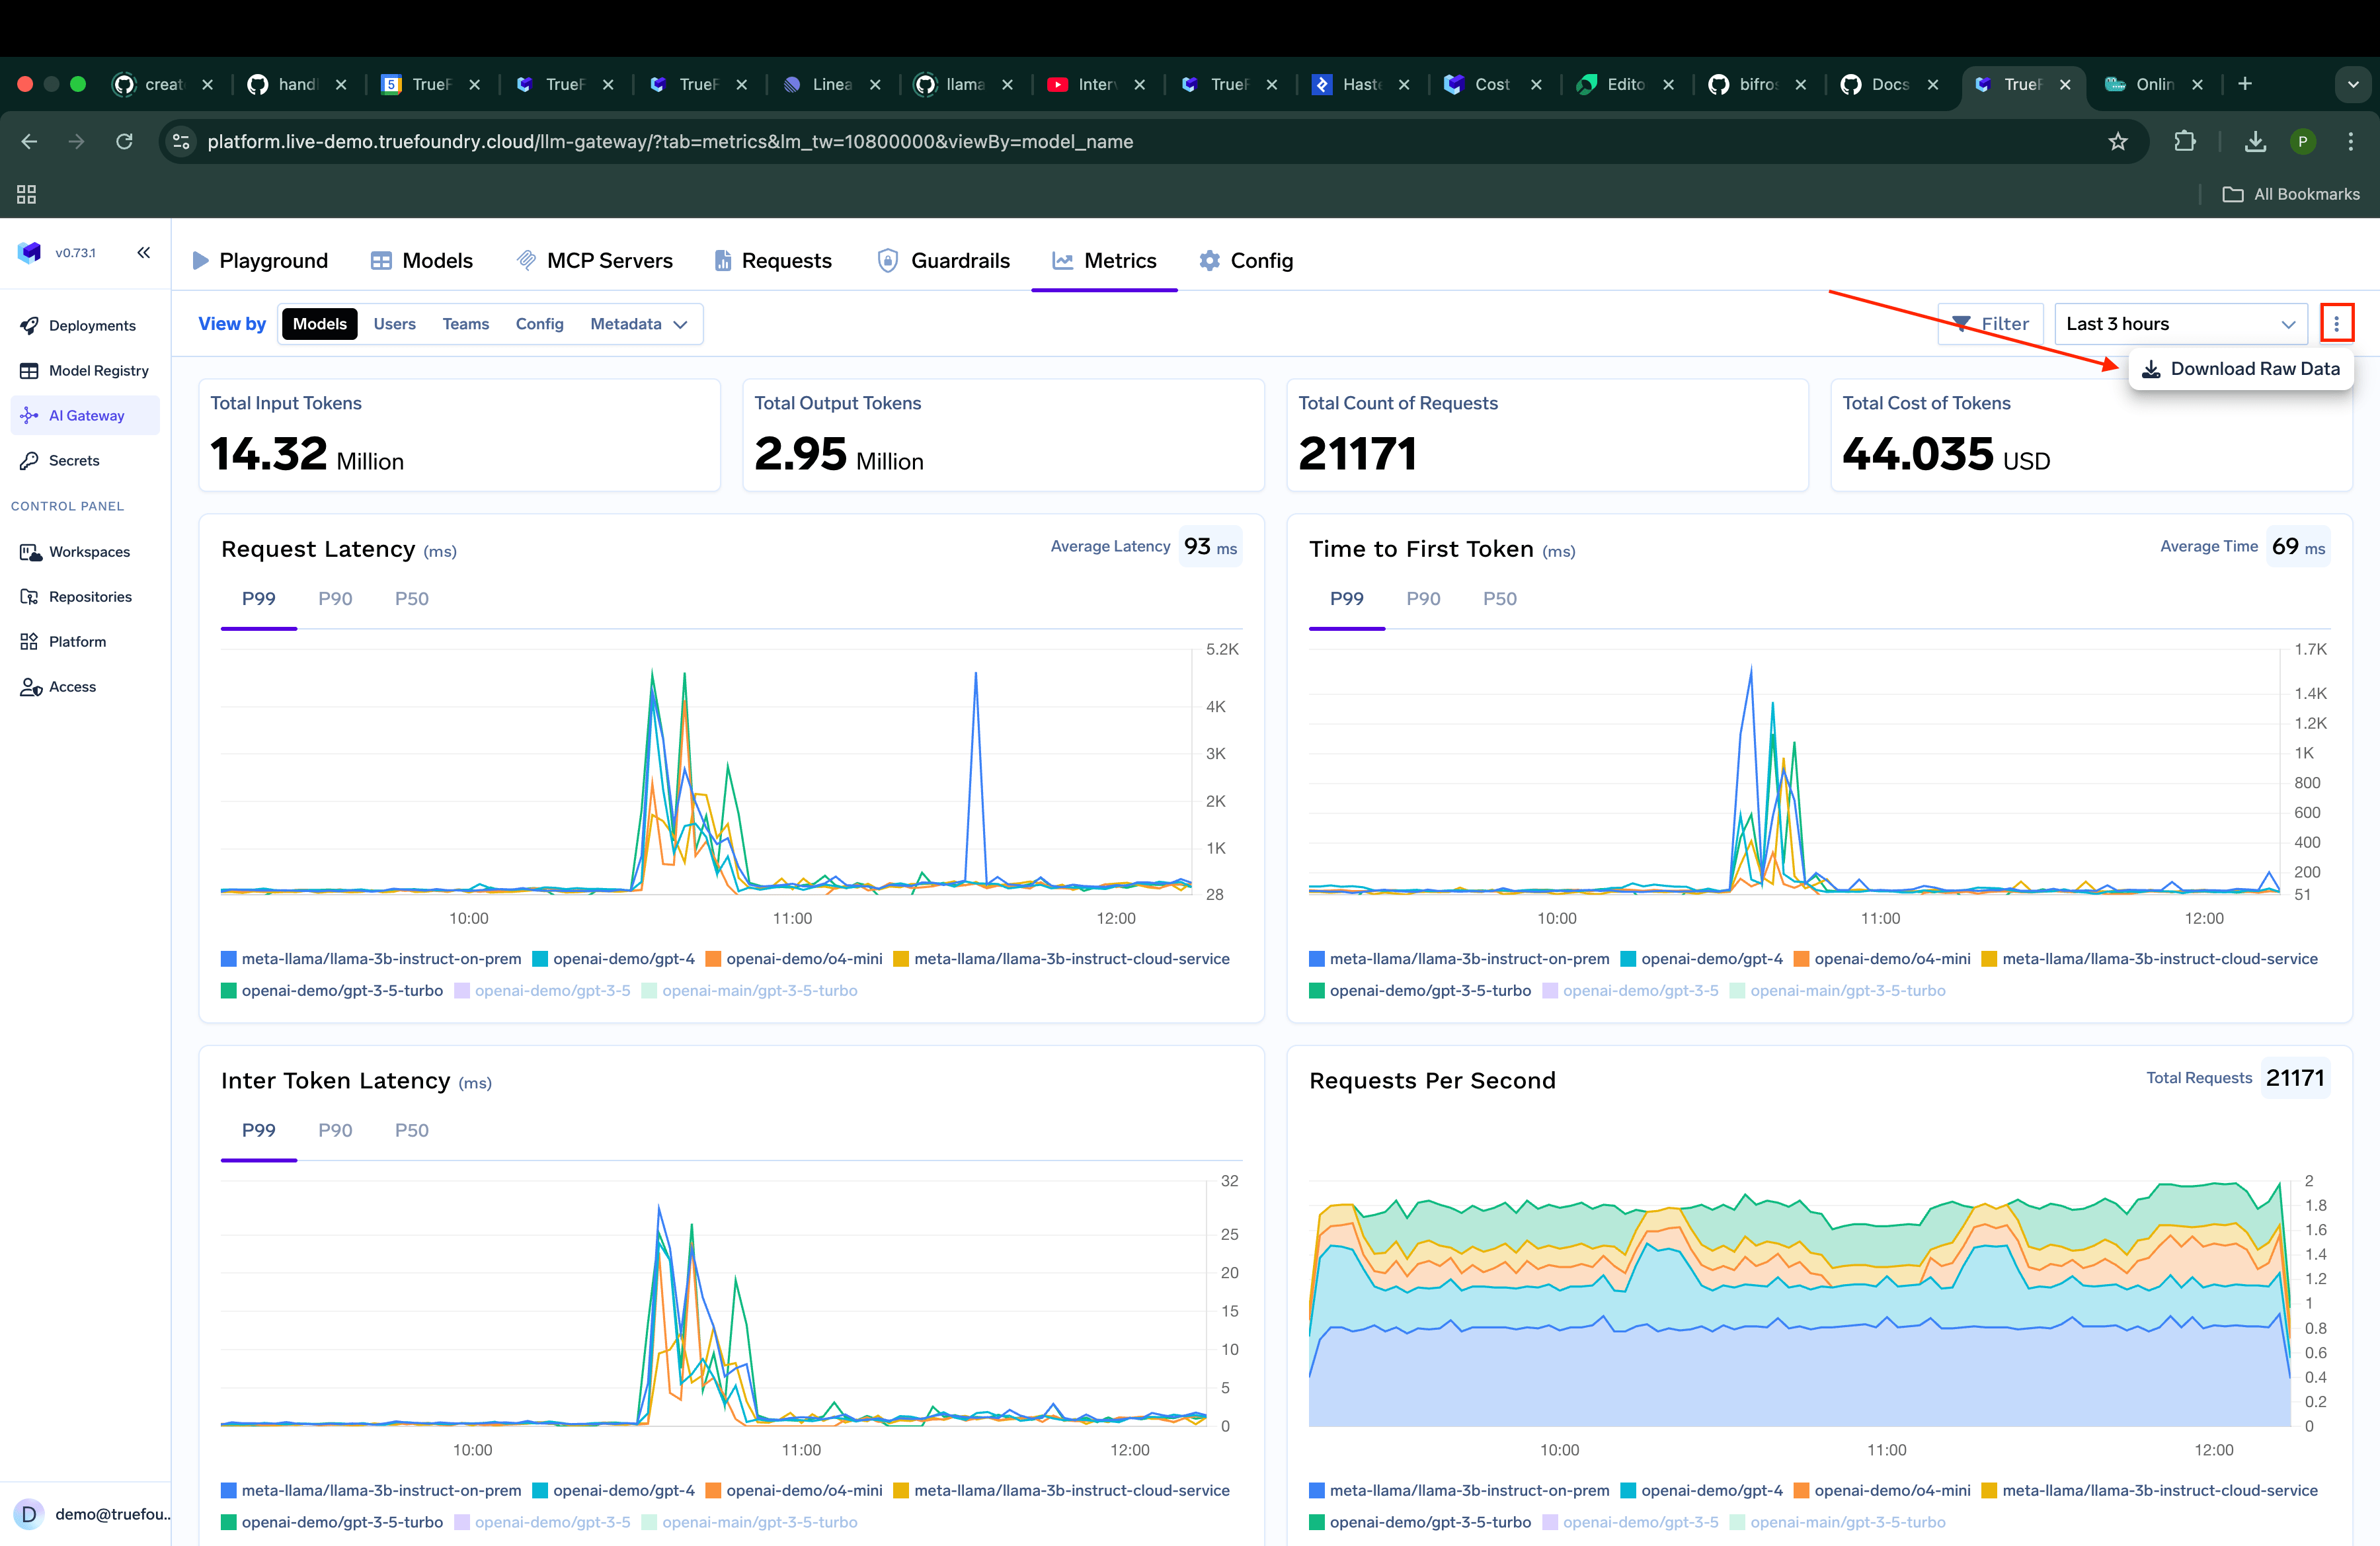
Downloading cost data
username, model_name, teams, or any metadata key.
Custom grouping options
Cancelled and disconnected streams
When a client cancels a streaming request mid-flight — a user closes the tab, an agent stops generation, a pod is evicted — the provider has usually already generated, and charged for, some tokens. Dropping the request at that point would hide that spend from dashboards and budgets. Instead, the gateway costs interrupted streams using a policy that matches how each provider bills a cancelled request:
The mapping is fixed in the gateway, based on measured provider behaviour, and is not configurable per provider or request. Note that Microsoft Foundry is distinct from Azure OpenAI and Azure AI Foundry, and Gemini AI Studio is distinct from Vertex AI — both are on the estimate policy.
How tokens are estimated
How tokens are estimated
Input tokens are exact wherever the provider reports them early. Anthropic sends usage twice — an input-only block in the opening event, and the final block at the end. A cancelled stream only receives the first, so the gateway keeps that count instead of guessing. The same applies to Google Vertex AI and to Anthropic models served through Bedrock and Azure. On a real prompt, the provider’s exact count was 154 tokens where a character heuristic gave 111.Output tokens are always estimated, because the provider never reports them for a cancelled stream. The gateway approximates from the text content it actually streamed — roughly one token per 3.5 characters. Image and file blocks are skipped, since their base64 payload would dwarf the real token count. Tool-call argument deltas and separate reasoning fields are not part of that count.When input tokens also have to be guessed (no early usage block), the same heuristic applies to the prompt text, plus a small per-message structural allowance.Cost is then calculated from those counts with the model’s public or private pricing, like any other request.
Identifying disconnected requests
Identifying disconnected requests
A disconnected request is recorded as a client disconnect, with error type
client-disconnected in request logs and model metrics. There is no separate “partial” flag. Cost is present on the estimate and do-not-cancel paths, and zero on do-not-bill.Filter on
tfy.model.tokens_estimated to separate measured spend from estimated spend. See TrueFoundry span attributes and filter client-disconnected spans.A client that hangs up just after a stream completes is not a disconnect: the stream is marked complete as soon as the terminal event is written, so it is recorded as an ordinary successful request.Effect on budgets, rate limits, and caching
Effect on budgets, rate limits, and caching
- Budgets — cost from a disconnected stream counts against budget limits exactly like a completed request. Do-not-bill requests carry zero cost and consume no budget.
- Rate limits — a cancelled request consumes a request-quota slot under all three policies. Rate limits count errors as well as successes, so repeatedly starting and aborting requests cannot bypass a requests-per-minute limit.
- Caching — a truncated stream is never written to the response cache, even though it is billed, so a cut-off answer is never replayed as a whole one. On the do-not-cancel path the stream is read to completion and cached normally.
Non-streaming requests
Non-streaming requests
A non-streaming response arrives in one piece, so cancelling it leaves nothing partial to cost. The gateway therefore finishes the upstream call when a client cancels a non-streaming request and bills the provider’s exact usage — for every provider, including those on the do-not-bill streaming policy.On a self-hosted AI Gateway, set
COMPLETE_NON_STREAMING_ON_CLIENT_CANCEL to false to abort the upstream call instead. It defaults to true. With it disabled, a cancelled non-streaming request attributes no cost, at the risk of under-reporting spend the provider still charges for.Current limitations
Current limitations
- Native Responses API streams are not estimated. A cancelled
/v1/responsesstream that never received its terminal usage event is recorded with zero tokens and cost. OpenAI (do-not-cancel) and Azure OpenAI / Azure AI Foundry (do-not-bill) are unaffected; Microsoft Foundry uses the estimate policy on chat completions, but a cancelled native Responses stream still records zero until that gap is closed. - Gemini and Bedrock passthrough endpoints read provider usage only. Requests on those native passthrough routes attribute no cost if cancelled before the provider reports usage.
- Proxy and text-to-speech passthrough requests are never billed on cancel.
- A network failure is not a client disconnect. If the provider connection dies mid-stream, the request is recorded as an error, not as billable truncation. When a provider reports an in-band failure while the client disconnects, the provider error takes precedence in the trace.